Updated: 23 dec 2025
Source
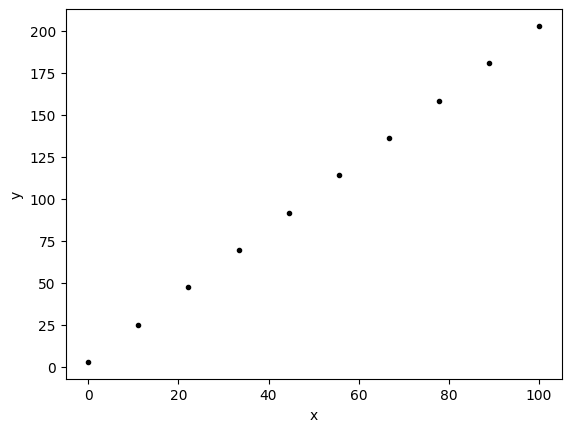
import numpy as np
import matplotlib.pyplot as plt


x = np.linspace(0,100,10)
y = 2*x+3

plt.figure()
plt.plot(x,y,'k.')
plt.xlabel('x')
plt.ylabel('y')
# plt.savefig('fig1.svg')
plt.show
Figure 1:some caption
Source
inline = 'some text'
second = np.arange(0,5,1)
print(second)
[0 1 2 3 4]
Using eval below to show content / output of the cell above.
some text
array([0, 1, 2, 3, 4])
Source
import numpy as np
import matplotlib.pyplot as plt

x = np.linspace(0,100,10)
y = 2*x+3


fig1, ax = plt.subplots()
ax.plot(x, y, 'k.')
ax.set_xlabel('x')
ax.set_ylabel('y')

fig1.savefig('fig1.svg')
fig1_caption = 'some caption here'
fig1_label = 'fig-no1'
plt.show()
figure below with eval for label and caption.
Figure 2:some caption here
Source
import numpy as np
import matplotlib.pyplot as plt
from IPython.display import Markdown

x = np.linspace(0,100,10)
y = 2*x+3


fig2, ax = plt.subplots()
ax.plot(x, y, 'k.')
ax.set_xlabel('x')
ax.set_ylabel('y')

fig2.savefig('fig2.svg')
caption2 = 'some caption here'

display(
    Markdown(
"""
    :::{figure} fig2.svg
    :label: fig-2

    {eval}`caption2`
    :::
"""
    )
)
Loading...
below there should be a code cell with caption
x = np.linspace(0,100,10)
y = 2*x+3


fig1, ax = plt.subplots()
ax.plot(x, y, 'k.')
ax.set_xlabel('x')
ax.set_ylabel('y')

plt.show()
#| caption: some caption
#| label: some-label
fig2, ax = plt.subplots()
ax.plot(x, y, 'k.')
ax.set_xlabel('x')
ax.set_ylabel('y')
plt.show()
Figure 3:some caption
fig2, ax = plt.subplots()
ax.plot(x, y, 'k.')
ax.set_xlabel('x')
ax.set_ylabel('y')
#| caption: some caption
#| label: some-label
plt.show()