Below we have some interactive content to display the results of our analysis.
Source
import numpy as np
import matplotlib.pyplot as plt
from ipywidgets import interact
import ipywidgets as widgets

N = 50
x = np.linspace(0,100,N)
y = 2*x + np.random.normal(0,10,N)

def update_plot(a):

    y_test = a*x

    plt.clf()
    plt.plot(x,y,'k.')
    plt.plot(x,y_test,'r--')
    plt.show()

interact(update_plot,a=widgets.FloatSlider(min=-4, max=4, step=0.1, value=1))
Output
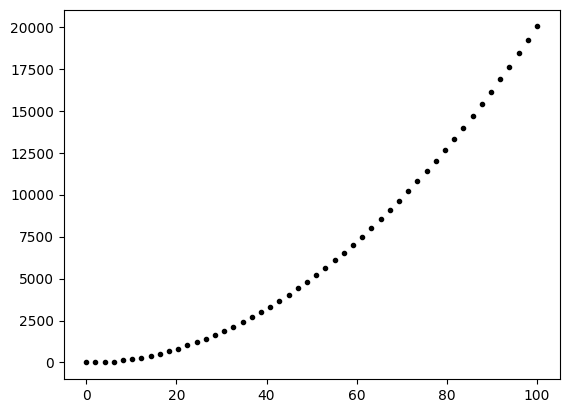
Or, another plot without interactive stuff:
Source
import numpy as np
import matplotlib.pyplot as plt


N = 50
a = 2
x = np.linspace(0,100,N)
y = 2*x + np.random.normal(0,10,N)
y_test = a*x

plt.figure()
plt.plot(x,y,'k.')
plt.plot(x,y_test,'r--')
plt.show()
Or an output which is shown but the code is not.